Welcome back to the #WeekendReads series! On periodic Fridays throughout the year, the Oakville Community Foundation will share reports, data and information to help you stay informed when it comes to the community, the charitable sector and more. Click here for previous installments.
Throughout the year, Statistics Canada is releasing data gleaned from the 2021 Census that will show trends, anomalies and interesting bits of data that can then help to inform our work. The previous 2016 Census has already informed many of our research reports, which can be read here.
The most recent data released includes a look at cultural backgrounds and racialized peoples.
What does Oakville look like?
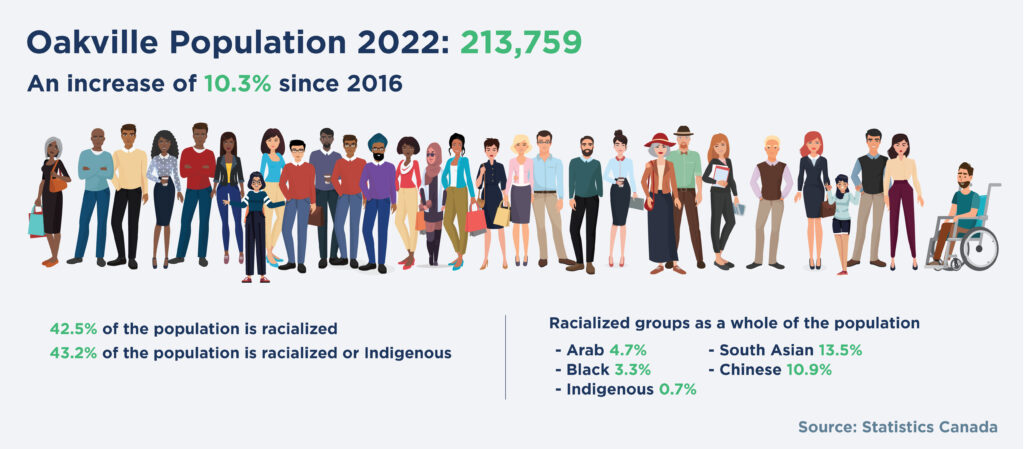
Oakville has dramatically changed since the 2016 Census in many ways. For starters, the population has grown by more than 10%, from 193,832 in 2016 to 213,759 in 2021. Oakville now ranks 11th in terms of population provincially and 25th nationally.
Additionally, the makeup of our population has changed. The total ”visible minority” population reported in the 2021 Census is 42.5%. This number has increased by 11.7% since 2016. In the span of five years, Oakville’s population has gone from nearly one-third visible minority, to nearly half.
South Asians now make up 13.5% of the population, while 10.9% are Chinese, 4.7% are Arab, 3.3% are Black and 0.7% are Indigenous.
Oakville’s immigrant population has also increased, going from 35.9% in 2016 to 41.2% in 2021. Most immigrants living in Oakville come from China (15.3%), India (10.2%) and the United Kingdom (7.4%).
What does the rest of Halton look like?
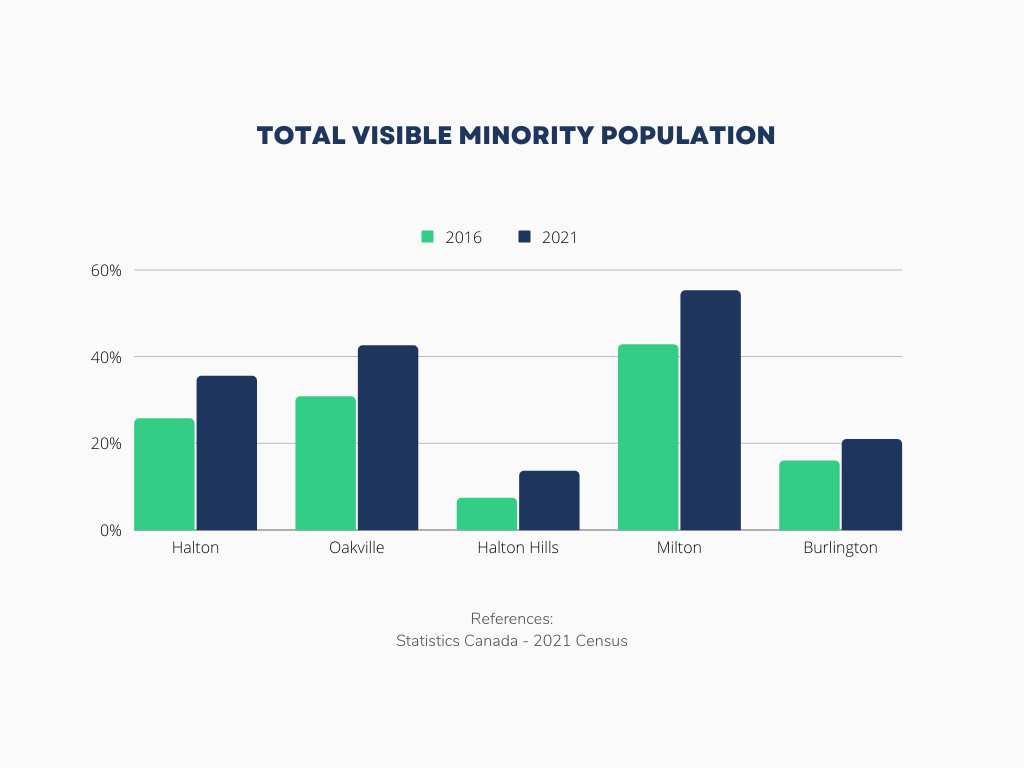 Milton has the highest visible minority population at 55.2% while Burlington (20.9%) ranks below Oakville and Halton Hills (13.6%) has the lowest visible minority population Across Halton Region there is a total visible minority population of 35.5%, or slightly more than one-third of the population.
Each community has seen their visible minority population grow since the 2016 Census. The largest visible minority population across Halton is South Asian at 13.8%. This is followed by Chinese at 5.4%, Arab at 3.7% and Black at 3.5%. Indigenous people make up 1% of the population across Halton Region.
The immigrant population in Halton Region has increased by 4.6% from 2016 to 2021, with immigrants now making up 34.2% of the population. The top places of birth for immigrants living in Halton Region include India (11.5%), the United Kingdom (9.4%) and Pakistan (9.1%).
What does this mean?
Statistics Canada has begun a consultation on the term “visible minority,” as it is no longer an adequate descriptor in many municipalities and considered offensive by some groups. Find out how to participate here.
For Oakville and Halton Region, as the makeup of our communities change, so too do the needs. The Foundation recently launched a report on Racial Identity and Belonging in Halton with a number of partners and encourage everyone to read the report and action plans from many organizations, including the Foundation, to address inequities and inclusion.
 The Foundation’s GIVEOakville campaign has a record number of charities looking for funding to continue supporting those in our community, including charities focused on supporting Black, Indigenous and People of Colour (BIPOC) individuals.
Charities include Black Mentorship Inc., Canadian Caribbean Association of Halton, Oasis Youth Care, Start2Finish and Debwewin: The Oakville Truth project. Each of these charities and their projects are available to support in the GIVEOakville Guide at www.giveoakville.com.
You may also be interested in: