Welcome to the Oakville Data Hub!
Here you can find a collection of data points that help to tell the story of our Town.
Over the years, The Foundation has published a number of reports and blogs that look at data relevant to Oakville and its surrounding areas. To make this as easily accessible as possible, we have compiled the data on this page. Additional data points will be added as they become available.
Click to enlarge any image or graph.
A majority of the data comes from Statistics Canada, specifically the 2016 Census of Population and the 2021 Census of Population. Additional information about elementary and secondary students comes from the Halton District School Board Student Census (HDSB) and the Halton Catholic District School Board Student Census (HCDSB).
Additional sources are listed in individual reports, which are linked in each accordion.
Demographics
Demographics are statistics that describe populations and their characteristics, such as age, race, gender, income and more. We use demographic data to ensure that we’re reaching the populations that need the most assistance and to ensure that our programs and grants are relevant to community members.
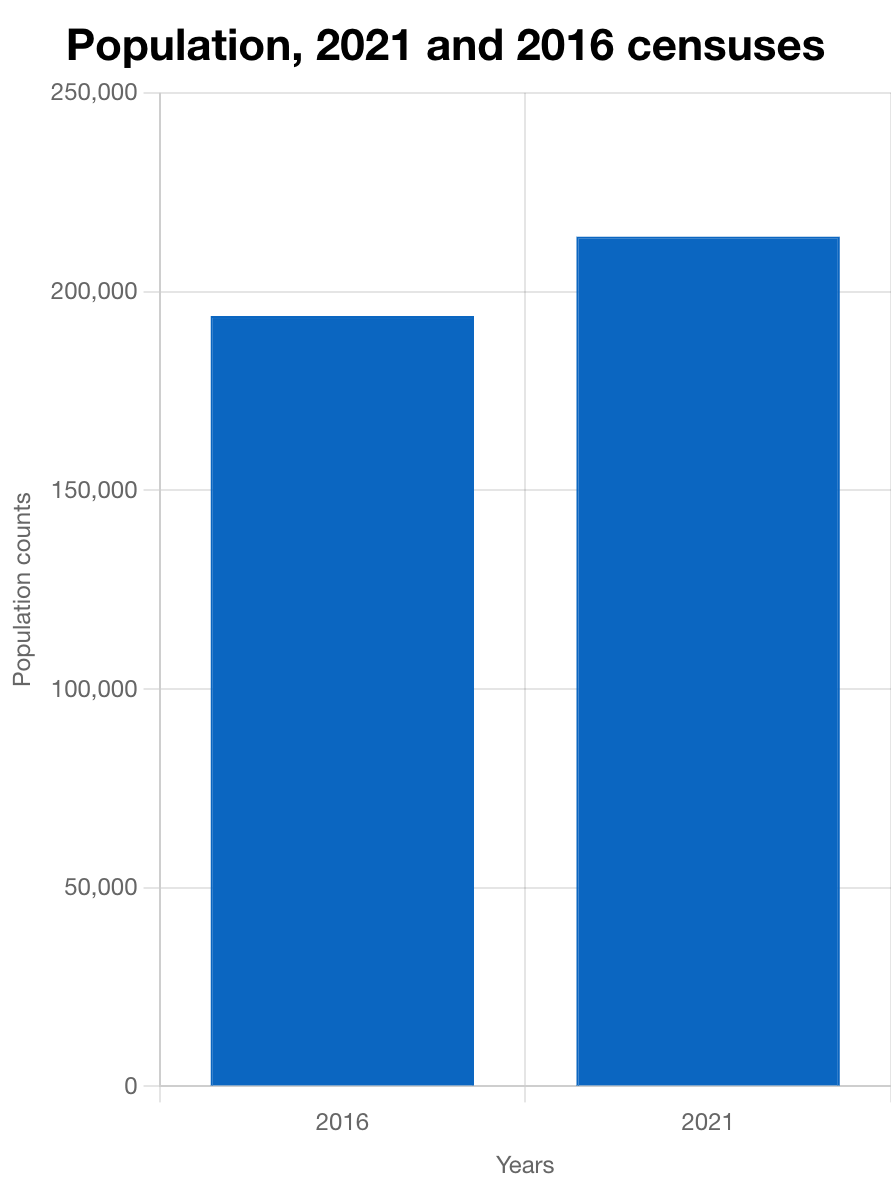
When we look at census data, we like to compare where we were four years ago to where we are now. Since 2016, the population in Oakville has increased by 10.3% to more than 213,000 people. The increase in Oakville is nearly twice both the provincial average (5.8%) and the national average (5.2%).
Oakville now ranks 11th among provincial populations and 25th among national populations, and had the second biggest increase in Halton behind Milton (20.7%).
Oakville’s land area is 138.94 square kilometers with a population density of 1,538.5 people per square kilometer.
The median age of the population is in line with the province, at 41.6 years old. This working age makes up the majority of the population, with 66.3% between the ages of 15 and 64, compared to 66.5% in 2016.
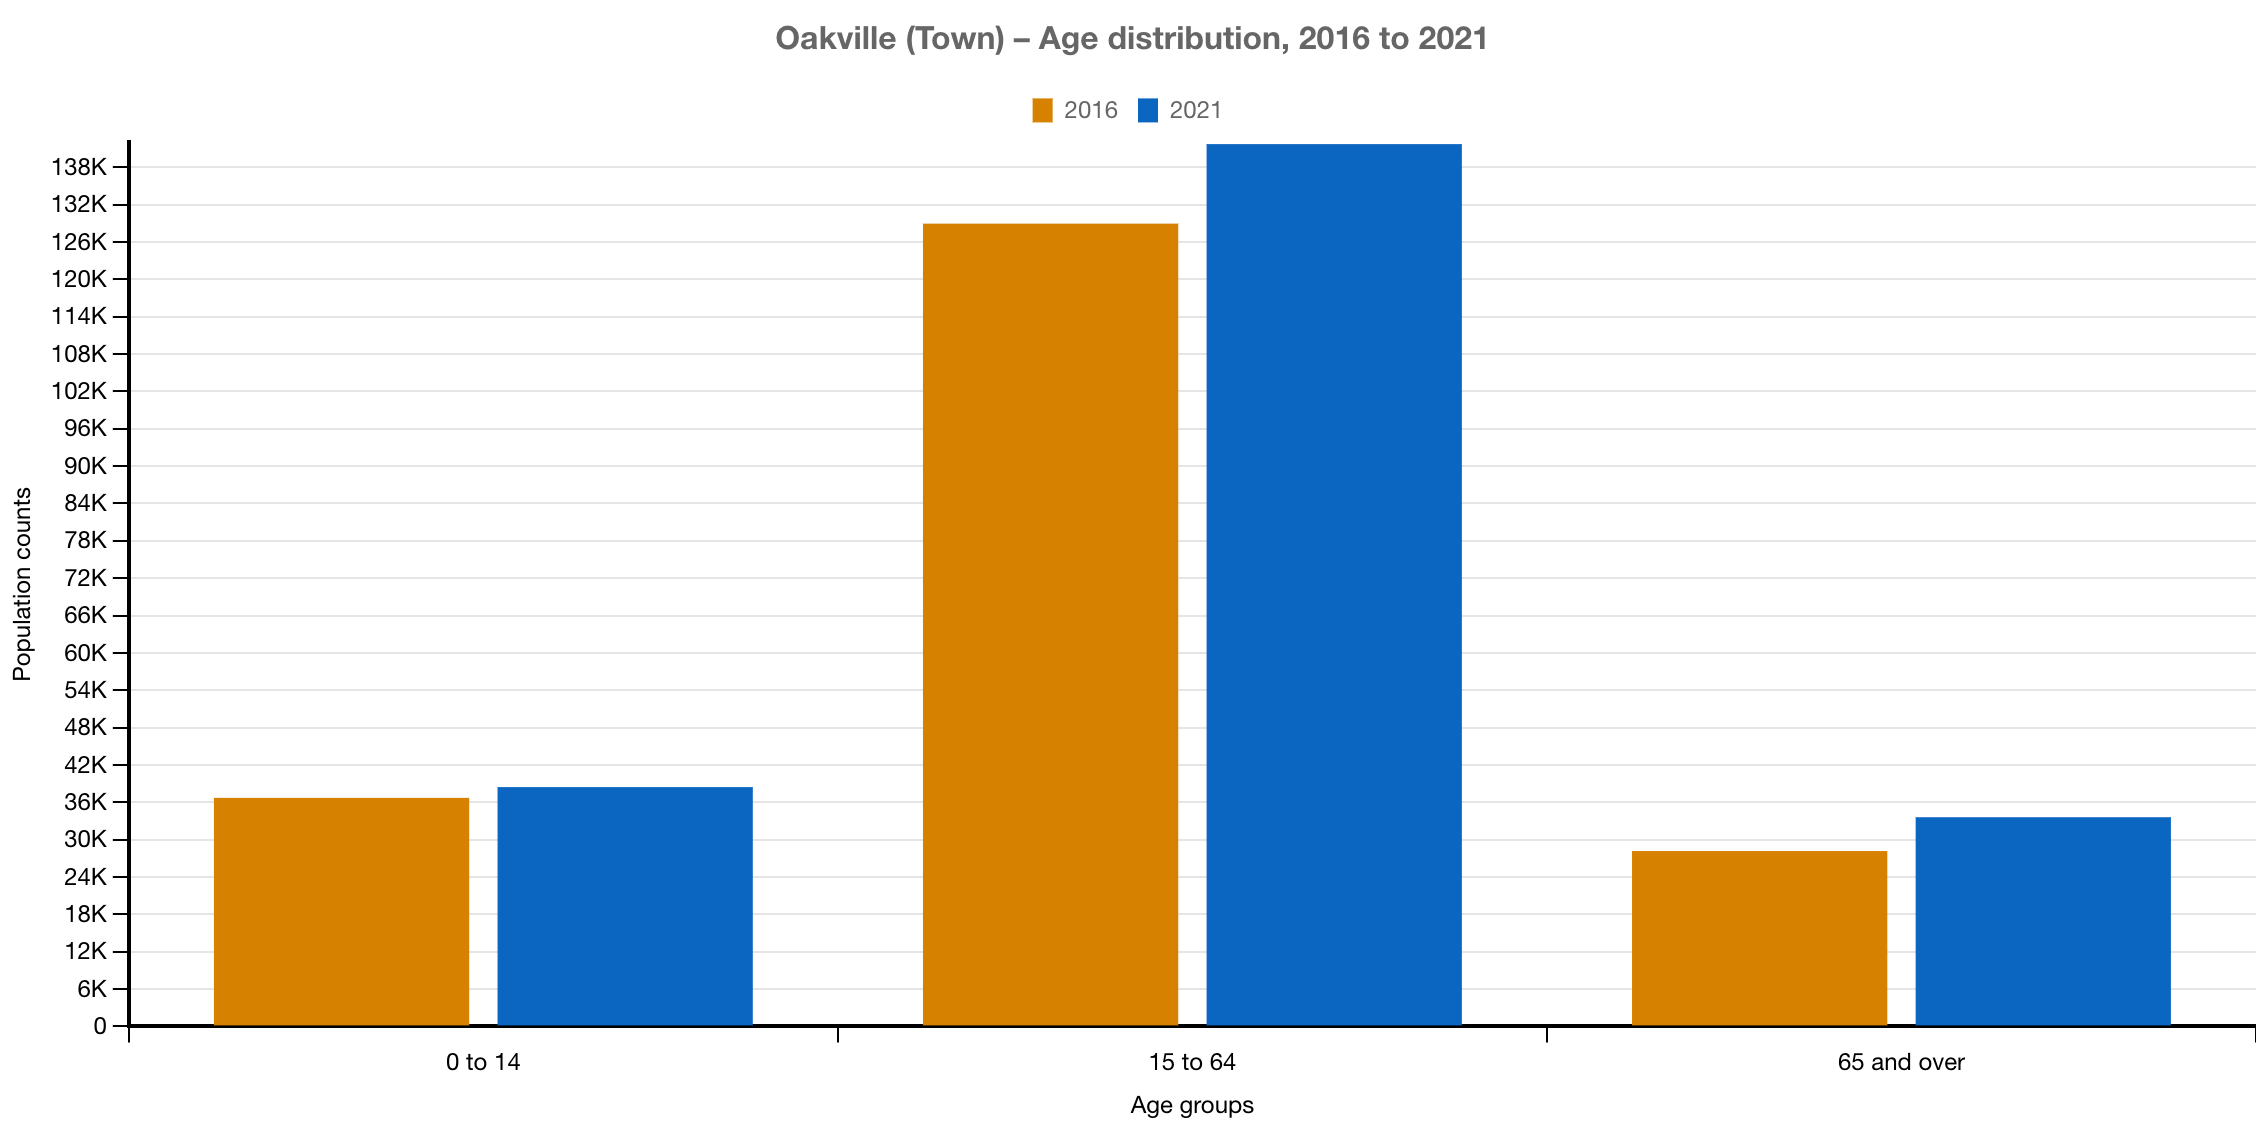
In 2021, children 14-years-old and under made up 18% of the population, down slightly from 18.9% in 2016 and higher than the national average of 16.3%.
The biggest age demographic change in Oakville is in older adults. Older adults 65+ represent 15.7% of the population, up from 14.5% in 2016. This is also lower than the national average of 19.0%.
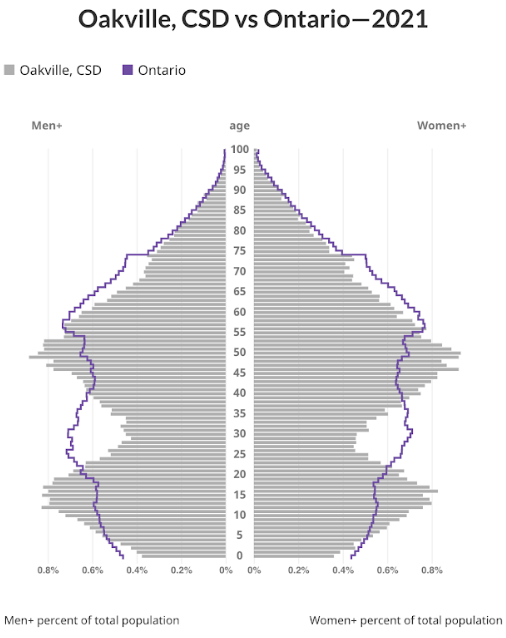 The proportion of men and women in Oakville is similar to that of Ontario. Men represent 48.4% of the population while women represent 51.6% of the population.
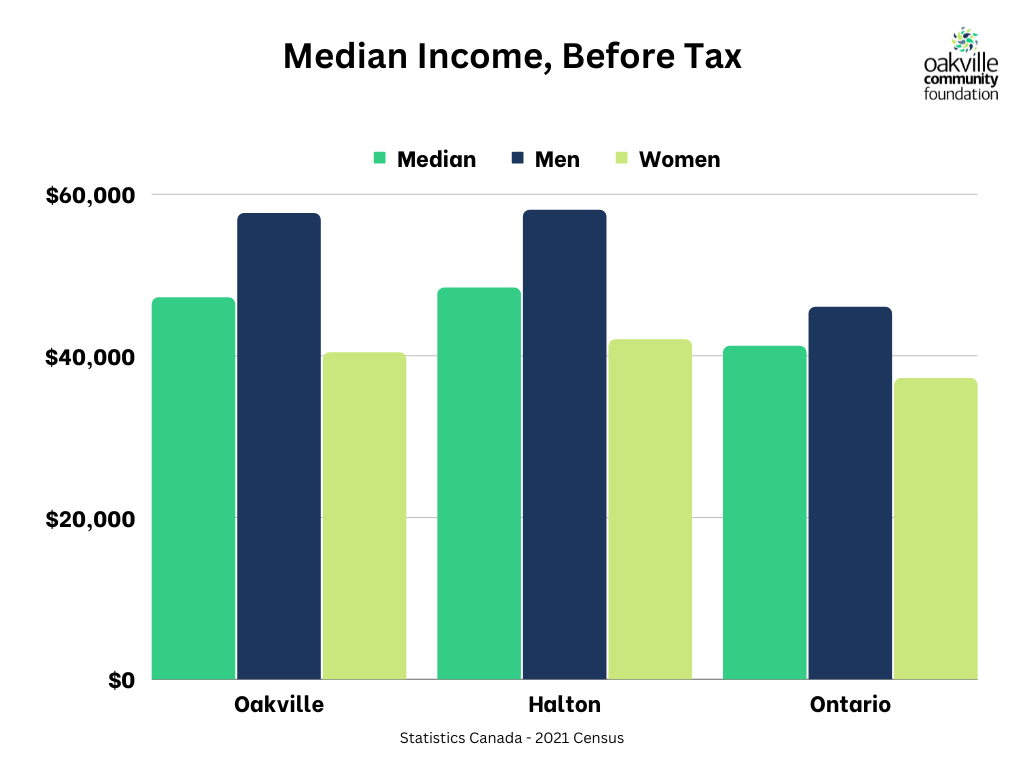
The median total income for an individual Halton resident was $48,400, 15% higher than the provincial average. As indicated in the chart above, the average income for a woman in Halton was $42,000 compared to $58,000 for men. This difference results in a 38% gender income gap in Halton.
Women are slightly older than men, at 42.8-years-old on average, while men are 40.8-years-old on average.
In HDSB elementary and secondary schools, 5% of students identify as gender diverse. In HCDSB secondary schools, 1.8% identify as non-binary, 1.4% as questioning, 1.2% as gender fluid and 0.6% as gender nonconforming.
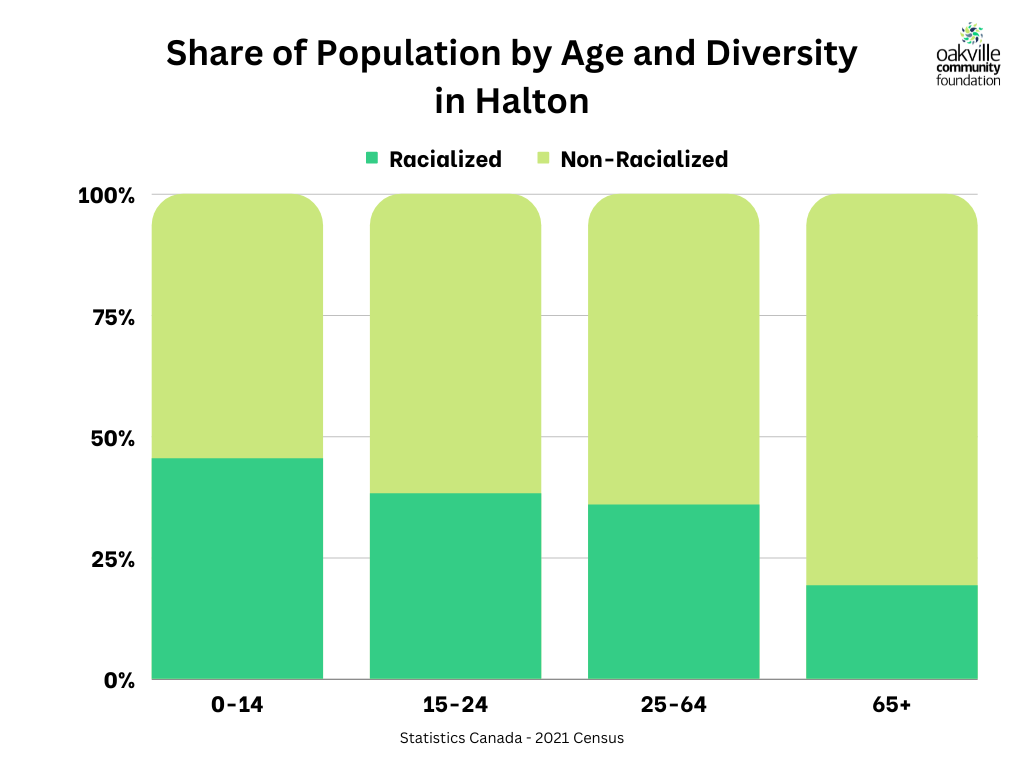
In Oakville, 43.2% of the population identifies as racialized or Indigenous. This is an 11.7% increase from 2016 (31.5%), meaning that in the span of five years, Oakville’s population has gone from nearly one-third racialized or Indigenous to nearly half.
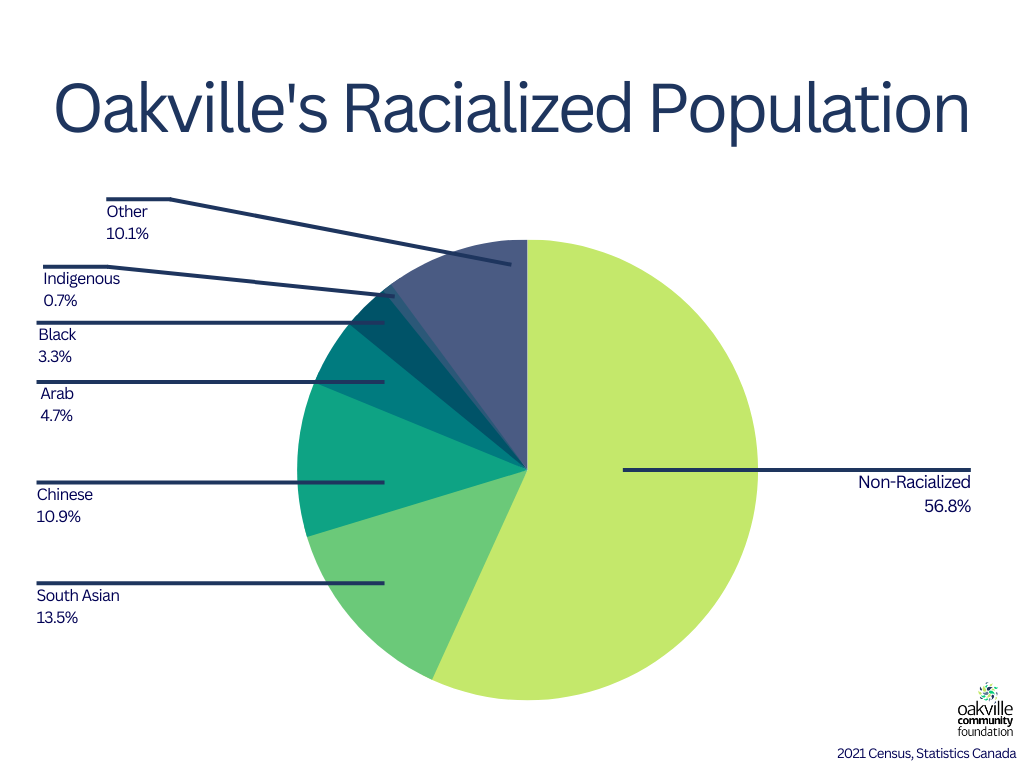
Racialized populations living in Oakville have continued to grow over the years, the largest including South Asian (13.5%), Chinese (10.9%) and Arab (4.7%).
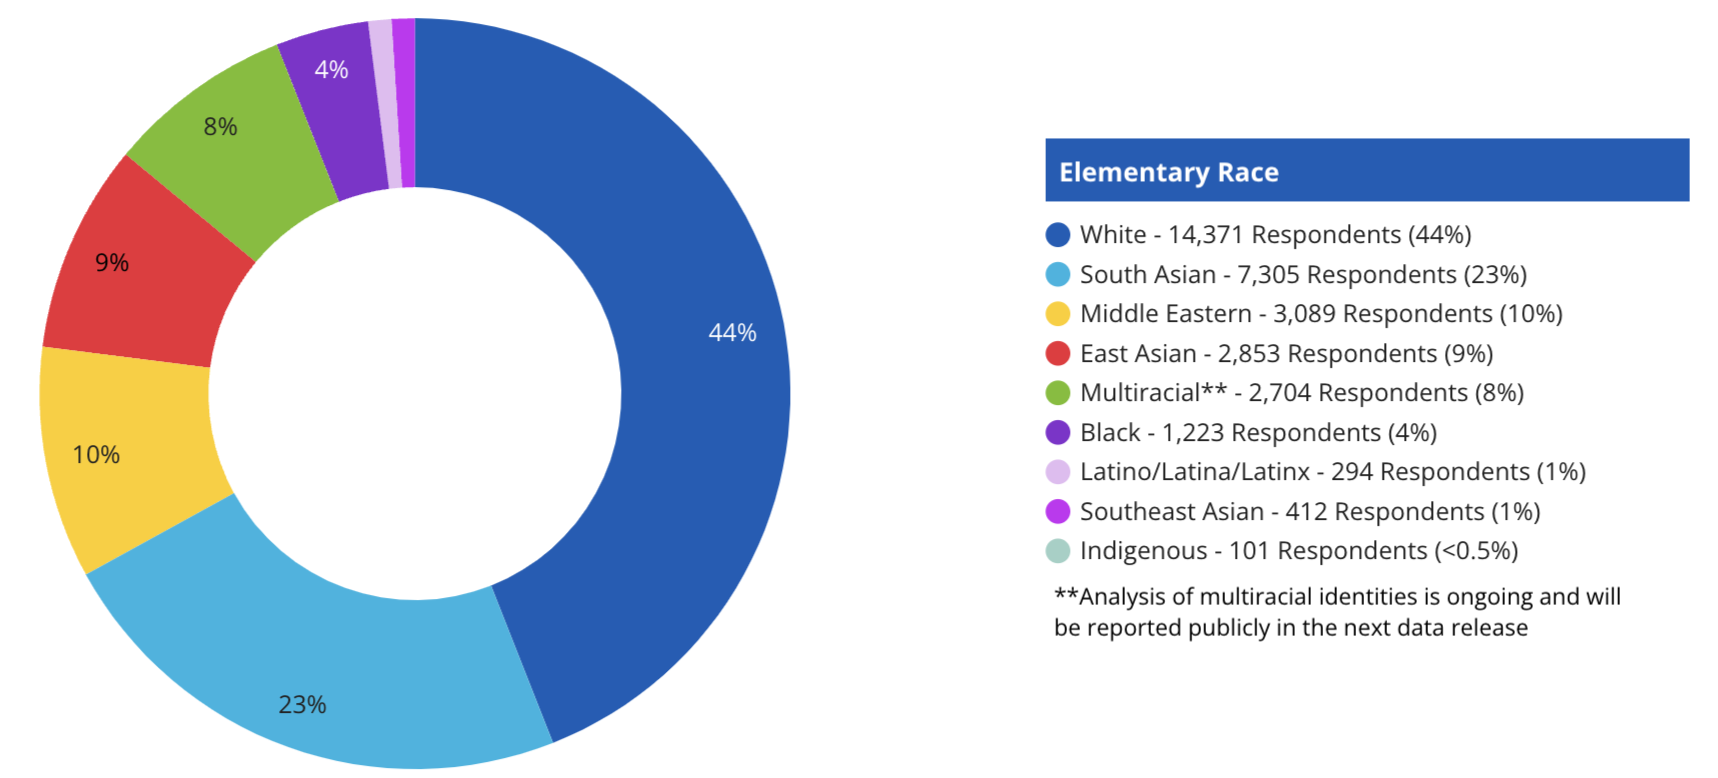
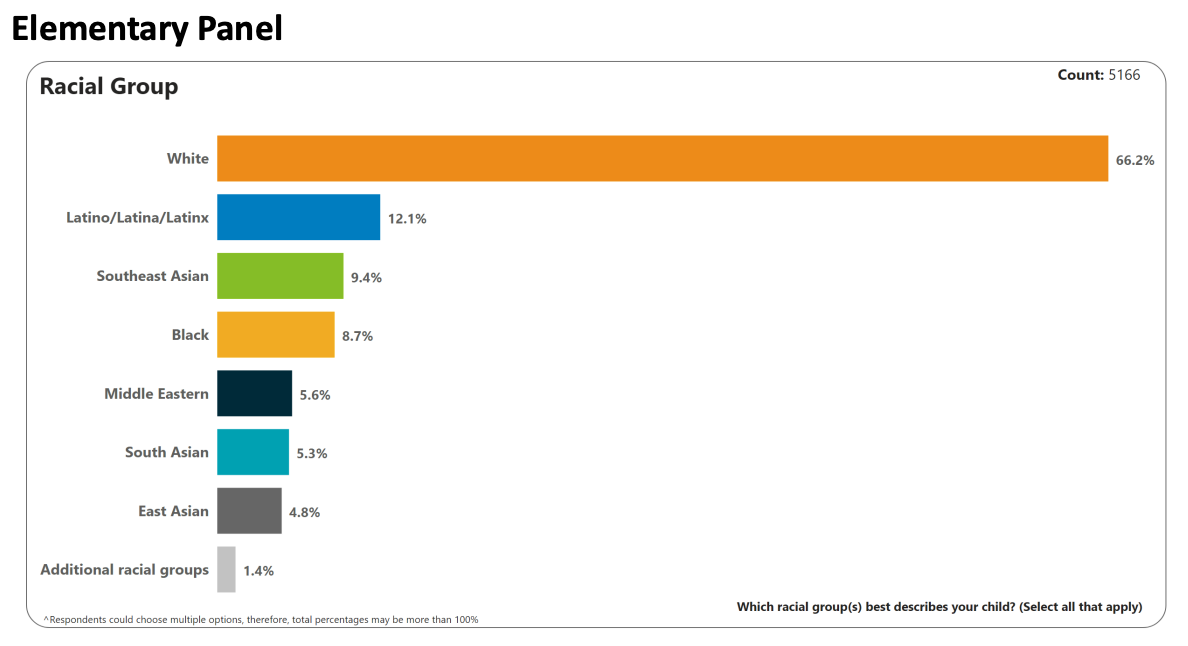
Elementary students at the HDSB identified most commonly as South Asian (23%), Middle Eastern (10%) and East Asian (9%). In HCDSB, 12.1% as Latino/Latina/Latinx, 9.4% Southeast Asian and 8.7% Black.
HDSB HCDSB
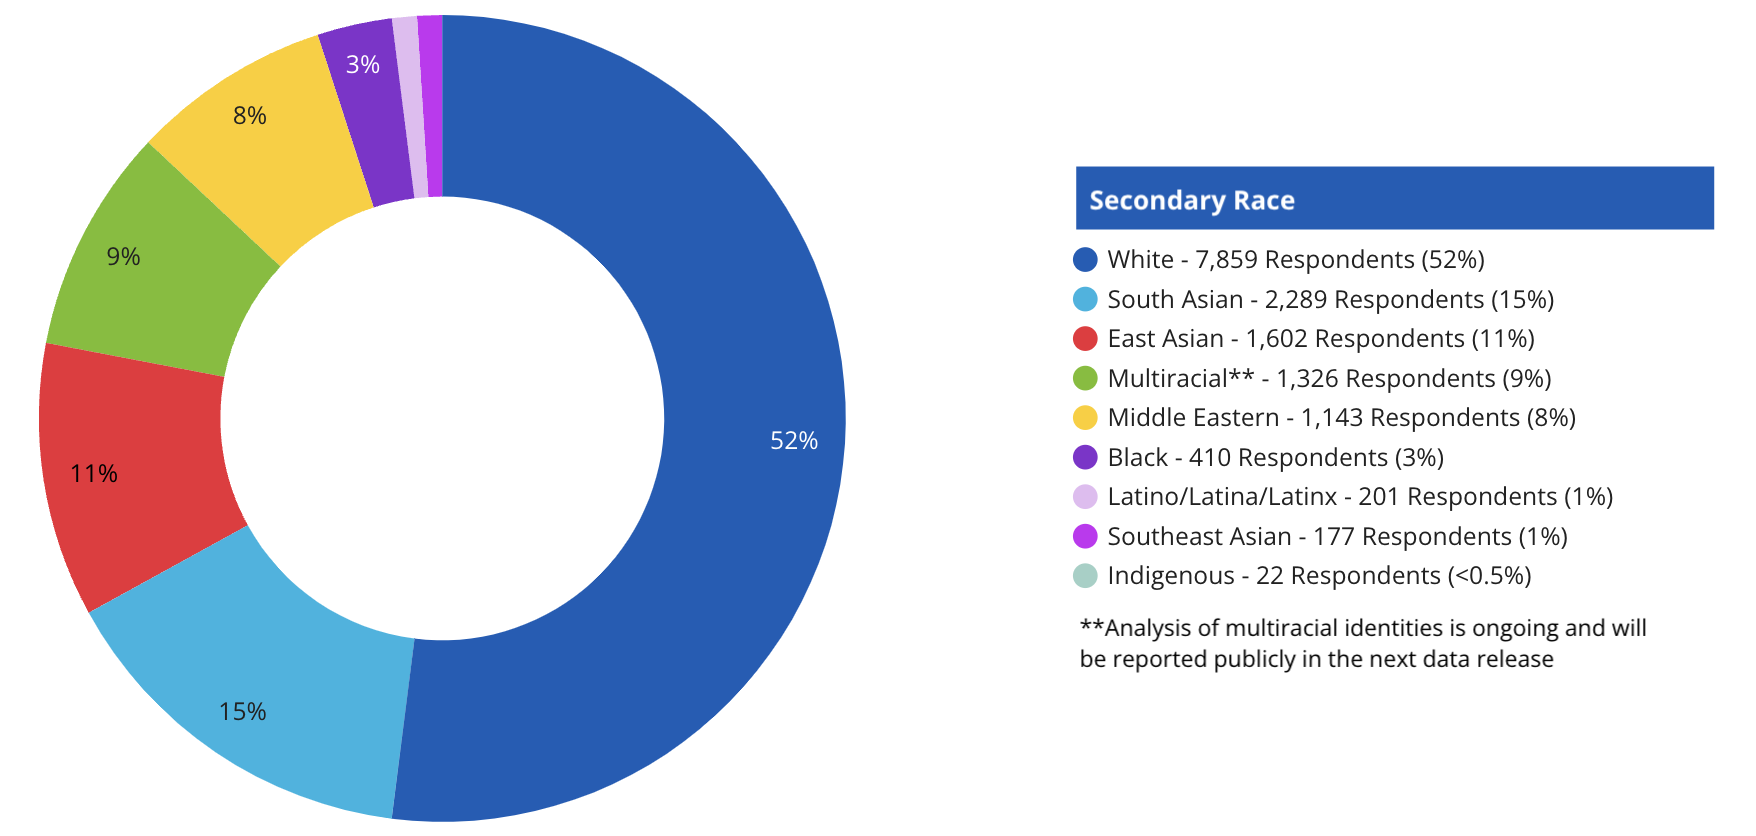
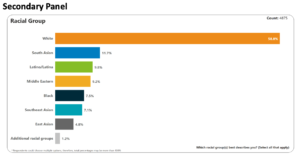
Similarly in HDSB secondary schools, 15% identify as South Asian, 11% as East Asian and 8% as Middle Eastern. Secondary students in HCDSB schools most commonly identify as South Asian (11.7%), Latino/Latina/Latinx (9.8%) and Middle Eastern (9.2%).
HDSB HCDSB
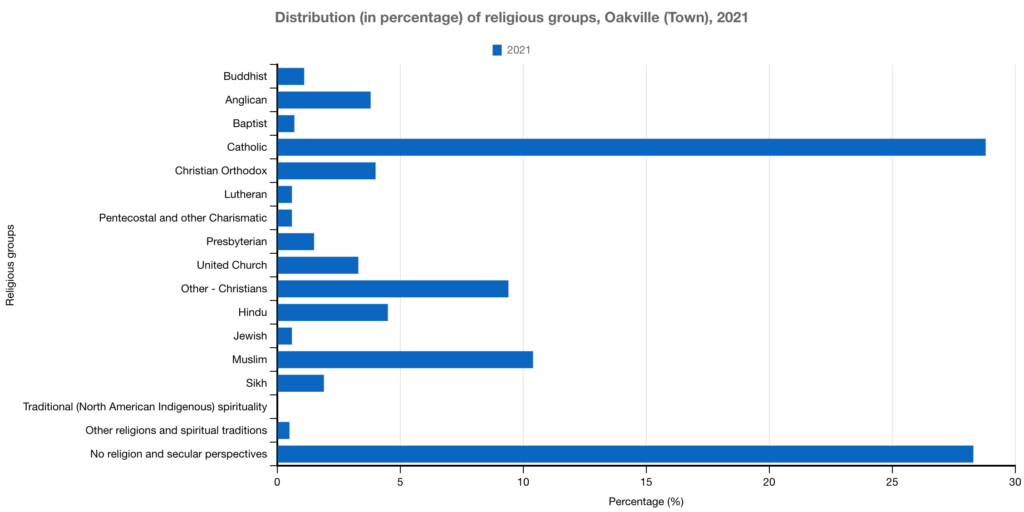
The largest religious affiliations in Oakville include Catholic (28.8%), Muslim (10.4%), Hindu (4.5%) and Christian Orthodox (4.0%). Additionally, 28.3% report no religion or secular perspectives.
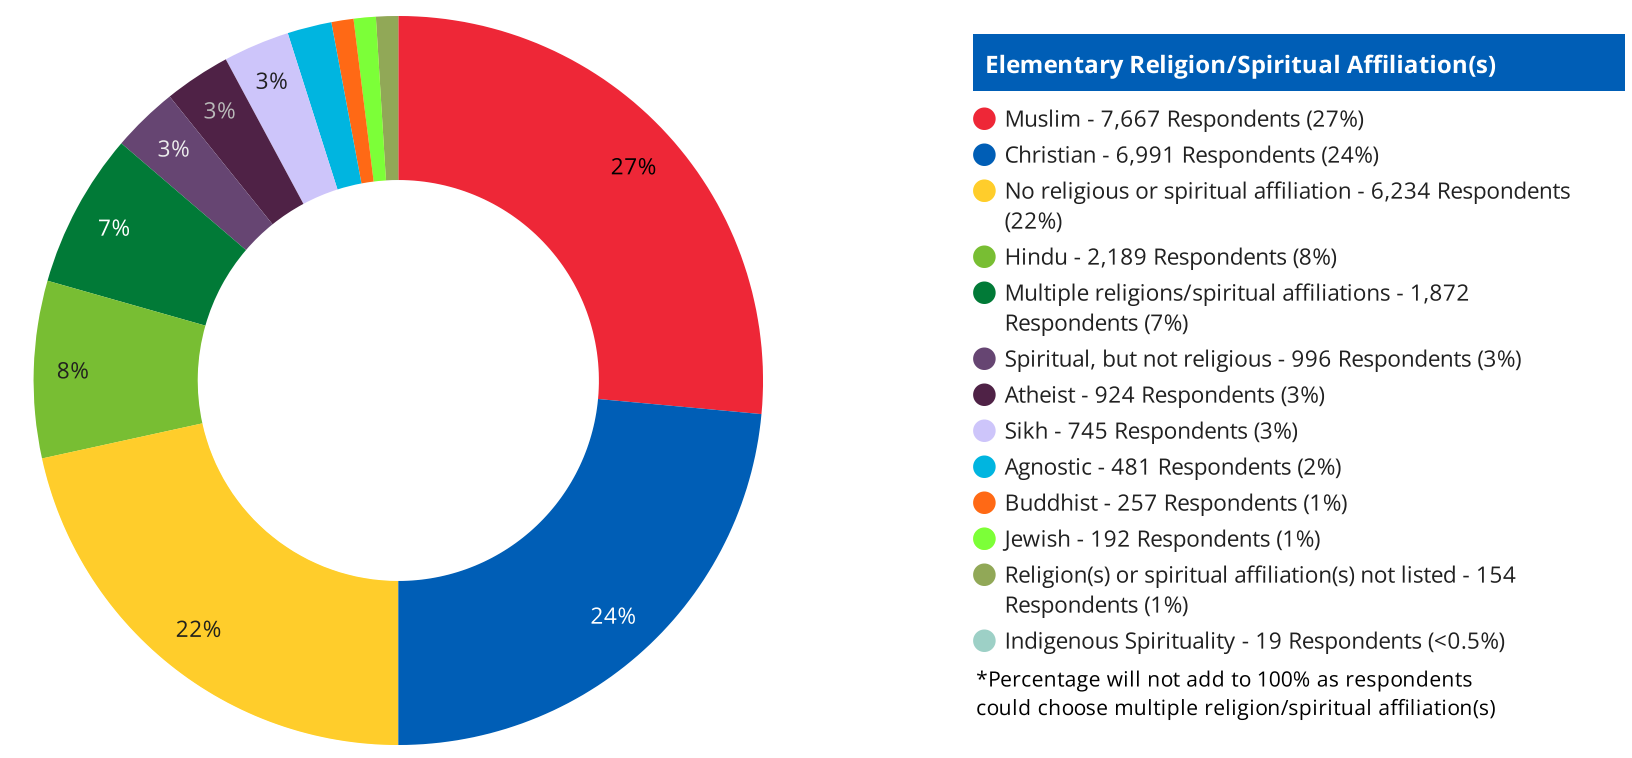
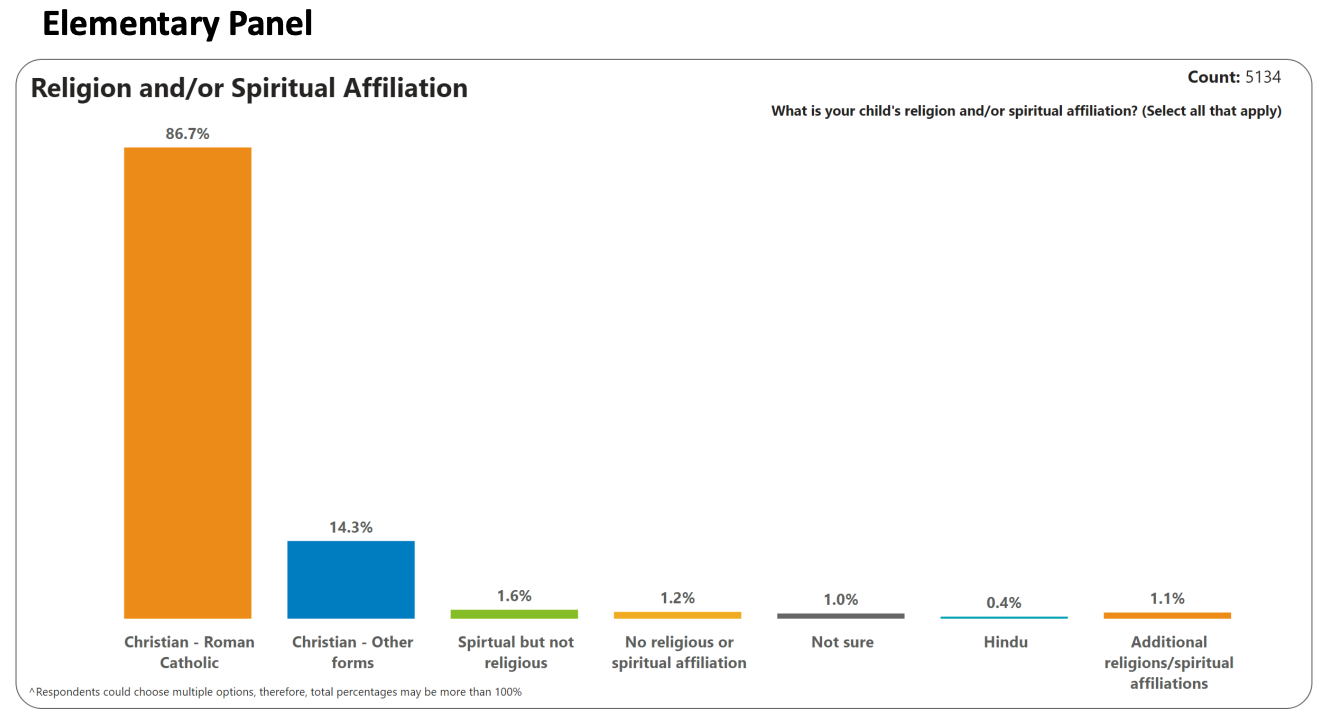
The student census also asks about religious affiliation. In HDSB elementary schools, 27% of students identify as Muslim, 24% as Christian and 8% as Hindu. In HCDSB schools an overwhelming number of students identify as Catholic (86.7%) or Christian (14.3%).
HDSB HCDSB
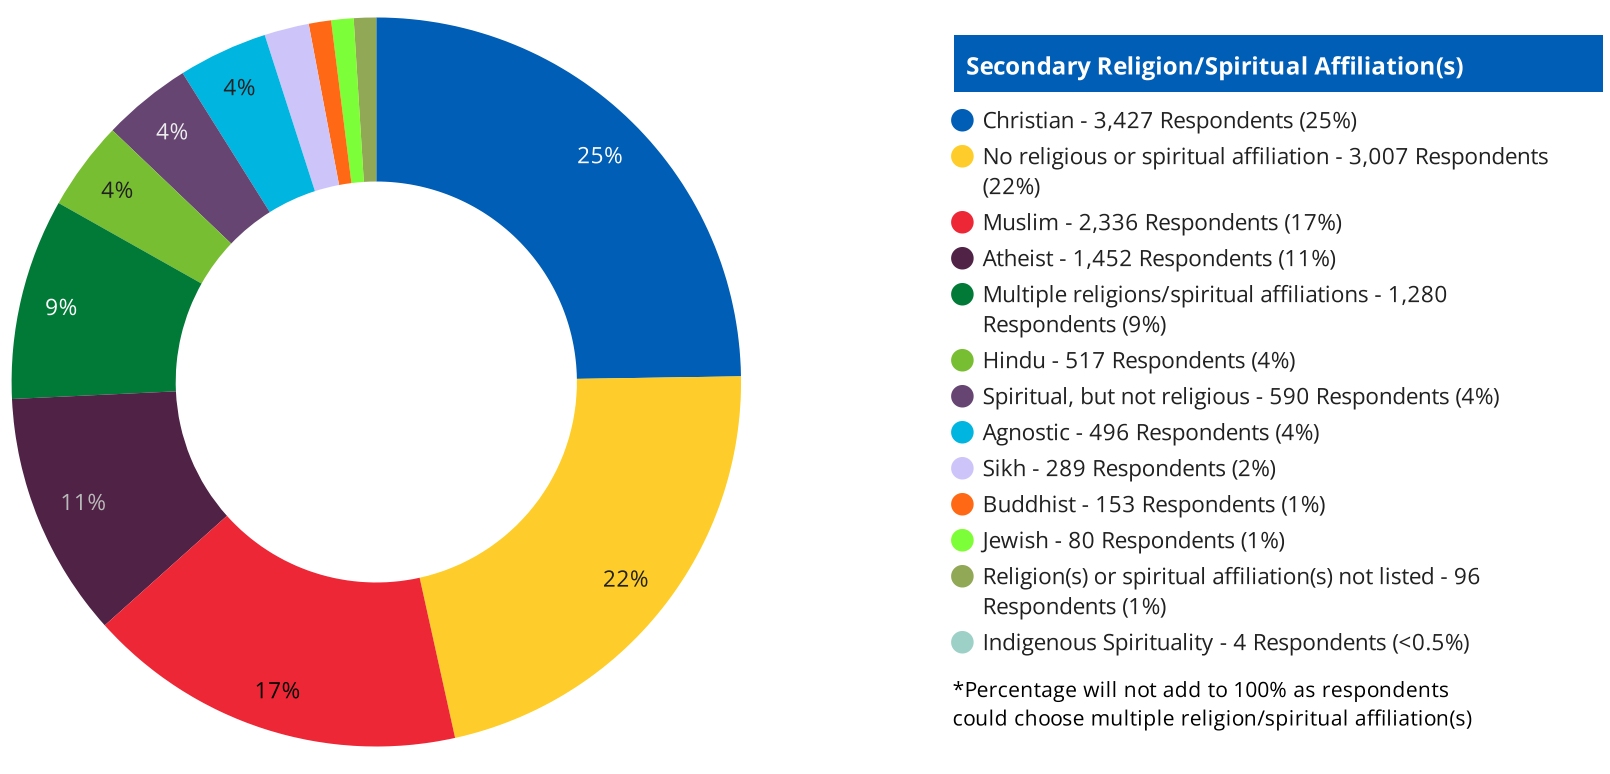
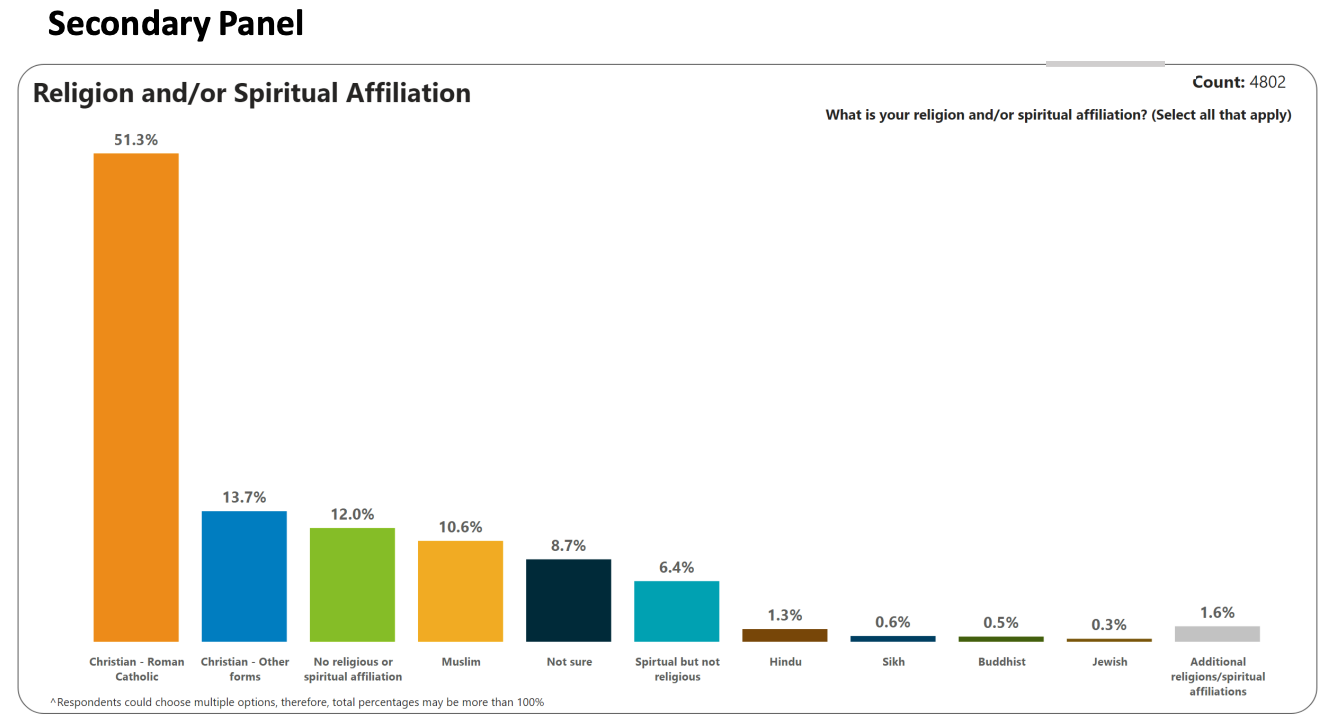
For HDSB secondary students, 25% identify as Christian, 17% as Muslim and 11% as Atheist. HCDSB secondary schools see a bigger change in religious affiliation: 51.3% identify as Catholic, 13.7% identify as other Christian denominations and 10.6% identify as Muslim.
HDSB HCDSB
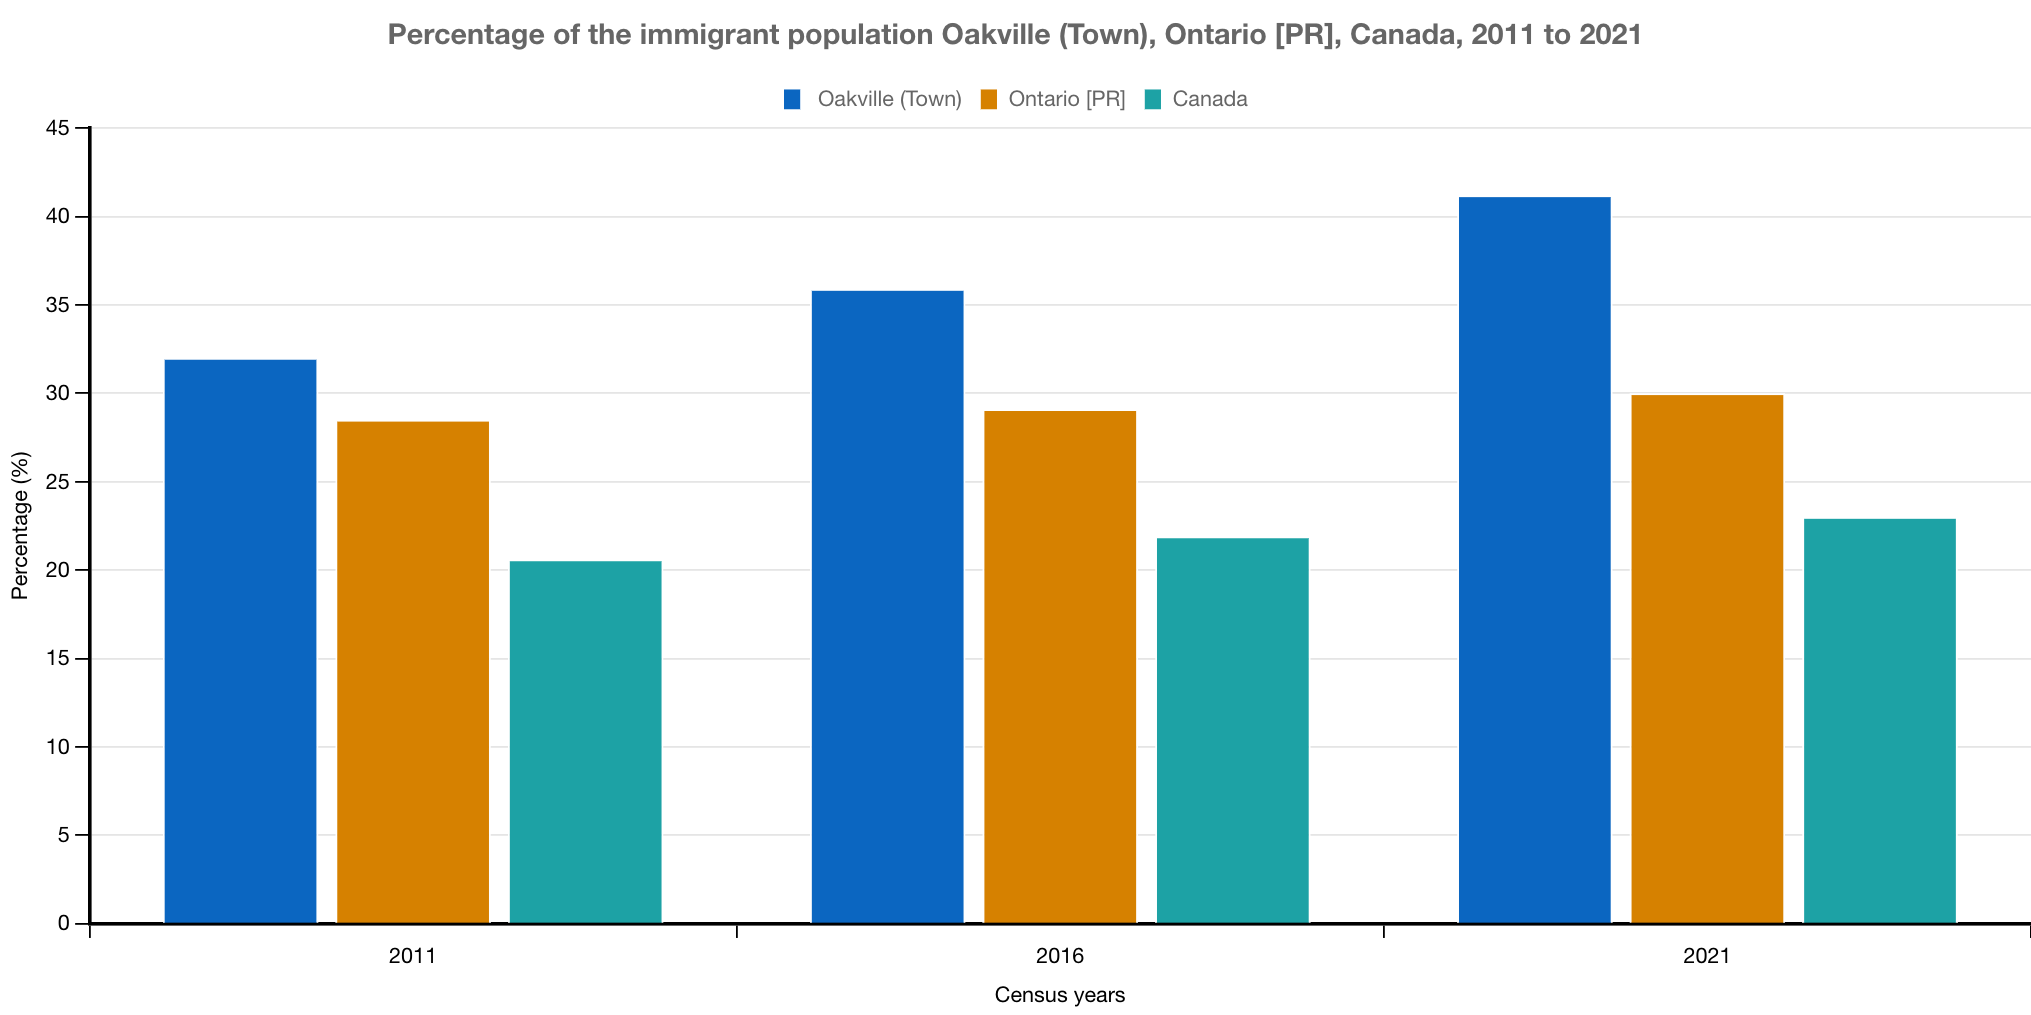
Oakville’s immigrant population has increased, going from 35.9% in 2016 to 41.2% in 2021. Additionally, 2.4% of the population are non-permanent residents. Recent immigrants, or those who settled in Oakville between 2016 and 2021, represent 17.7% of the immigrant population.
Most immigrants living in Oakville come from China (15.3%), India (10.2%) and the United Kingdom (7.4%).
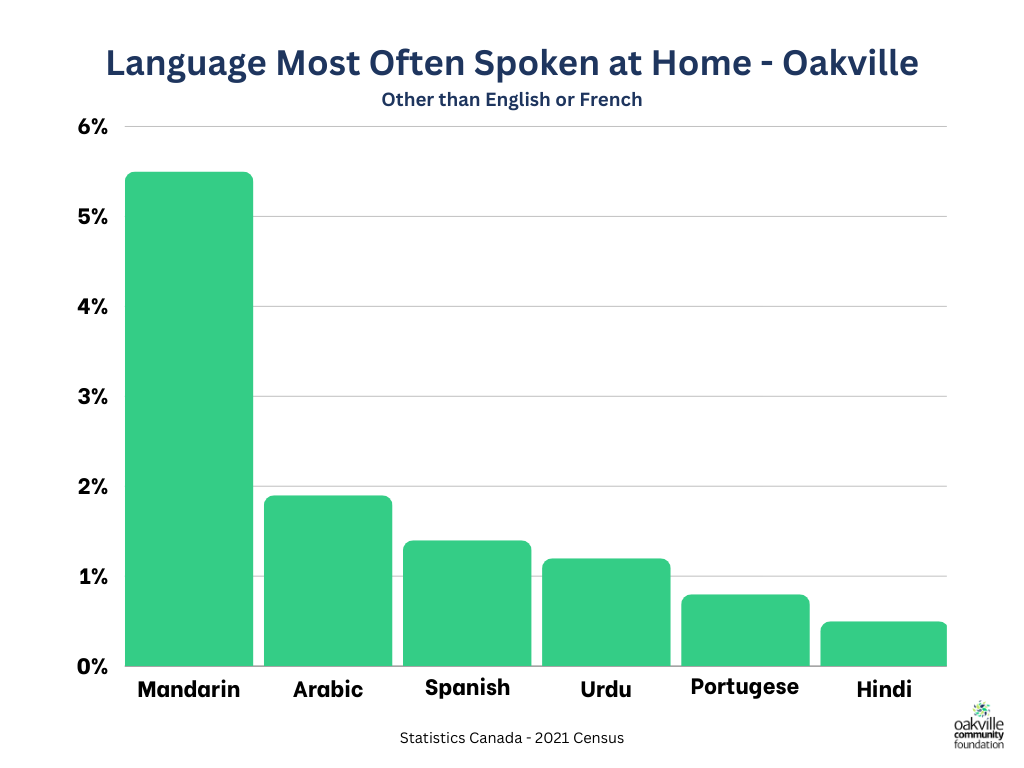
Oakville is home to many languages and 19.3% of the population regularly speak a language other than English or French at home. Some of the most spoken languages at home are Mandarin (5.5%), Arabic (1.9%), Spanish (1.4%), Urdu (1.2%), Portuguese (0.8%) and Hindi (0.5%).
On the surface, it may seem like Oakville is an exceptionally wealthy town. The average annual after-tax income in Oakville is $108,000, which is a 4.9% increase from 2015 ($103,000). This is higher than both Burlington ($94,000) and Milton ($107,000). Additionally, 31.8% of households in Oakville bring home more than $150,000 annually.
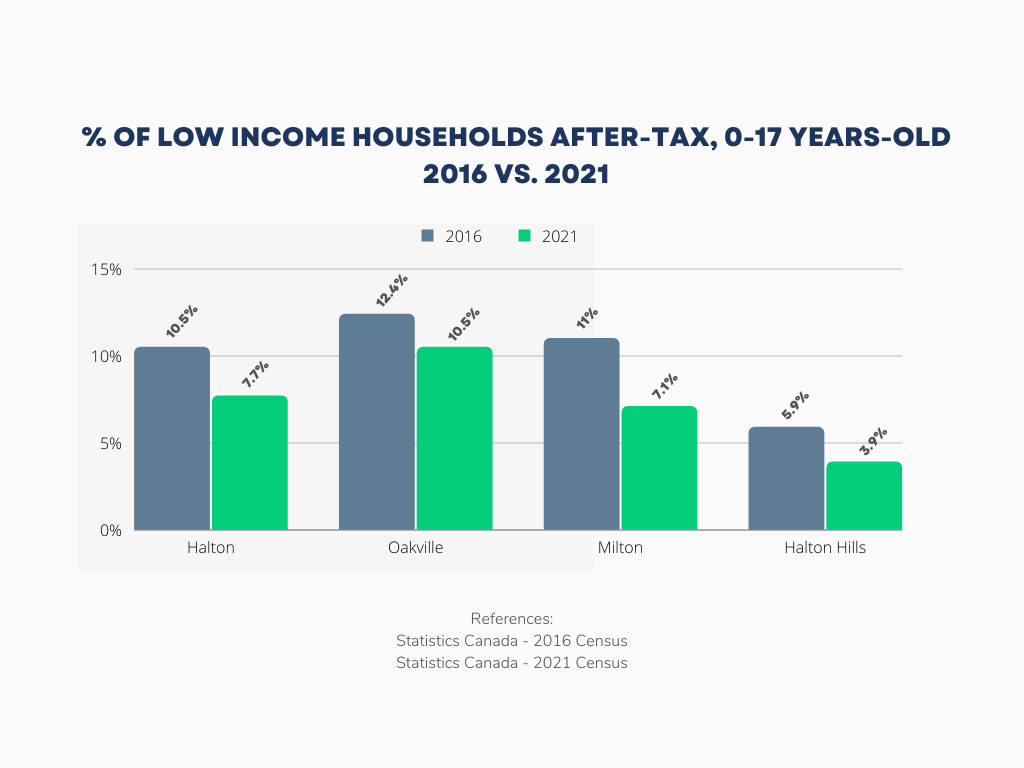
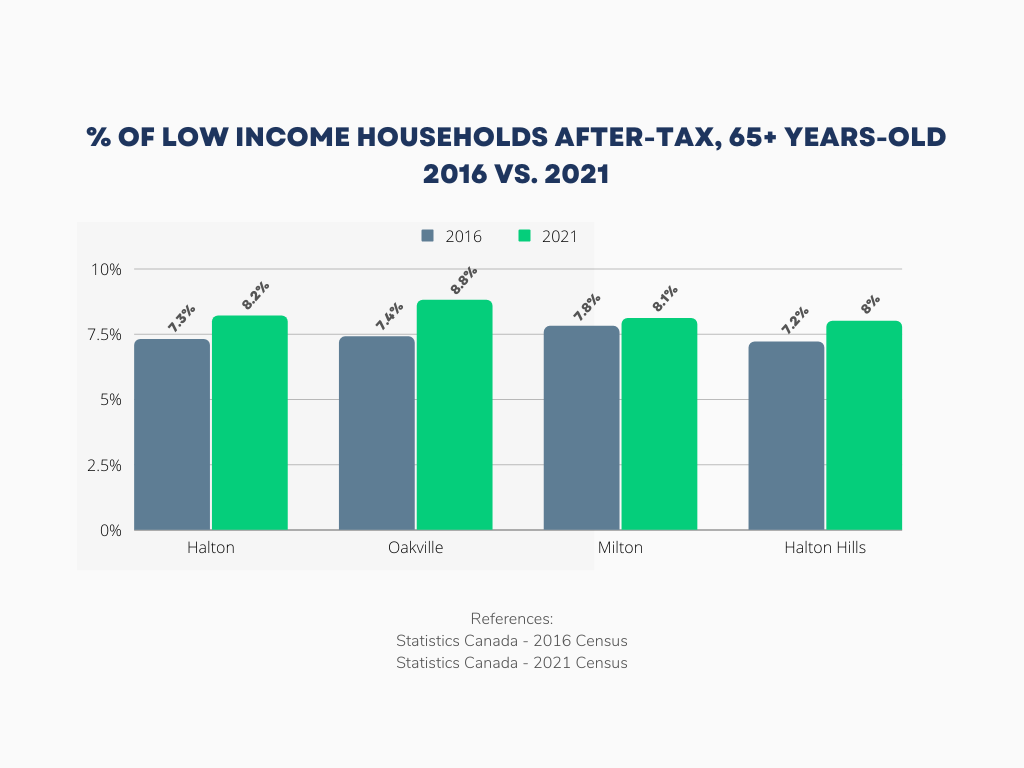
However, 8.6% of Oakville residents are considered low-income. This includes 10.5% of youth, 0-17-years-old and 8.8% of older adults aged 65+.
The median total income for an individual Oakville resident was $47,200, nearly 15% higher than the provincial average. The median income for a woman in Oakville is $40,400 compared to men at $57,600. This difference results in a 42.5% gender wage gap.
Research Categories
The following research categories come directly from The Foundation’s research reports and focus on things like: food security, housing and shelter, climate change and more.
In a Halton-wide survey, 17% of respondents indicated they were concerned about the loss of food programs or services for themselves or others in their households. Organizations like the Kerr Street Mission indicated that, on average, 712 people benefitted from their Food Market in 2022, a 9% increase year over year. Food For Life also supported 3,200 households per week, rescuing a total of 4,960,000 pounds of food that went back out into the community.
In 2022, Food4Kids indicated they supported 921 kids, an increase of 21% year-over-year. In 2023, this number has increased to more than 1,000. That’s 24,386 food bags and $204,600 worth of gift cards. Since the COVID-19 pandemic, the number of children they have supported has increased by 26%.
This are just a few excerpts from the report: Are We Hungry?
Click here to read: Are We Hungry?
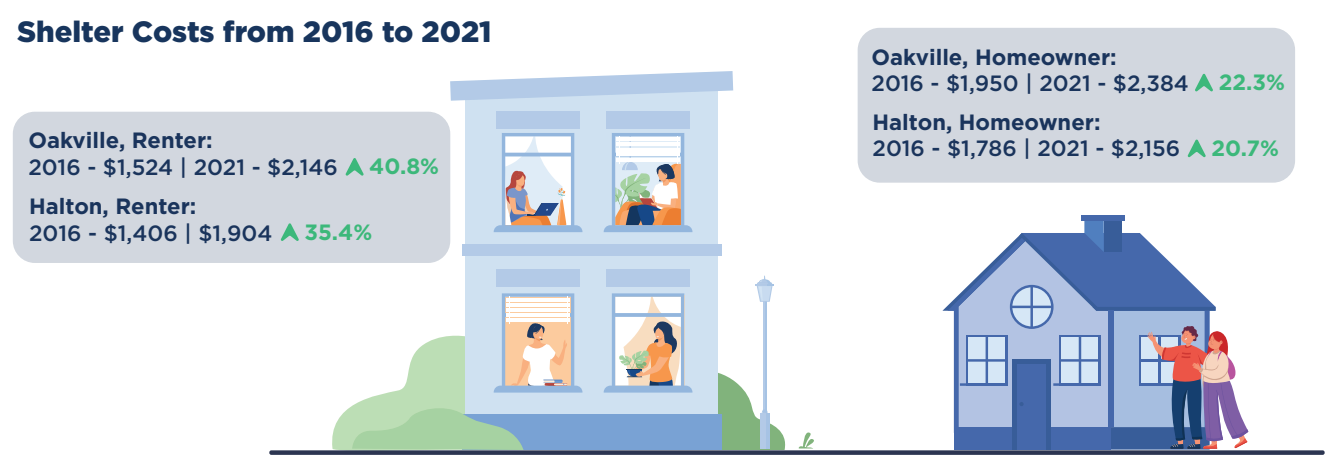
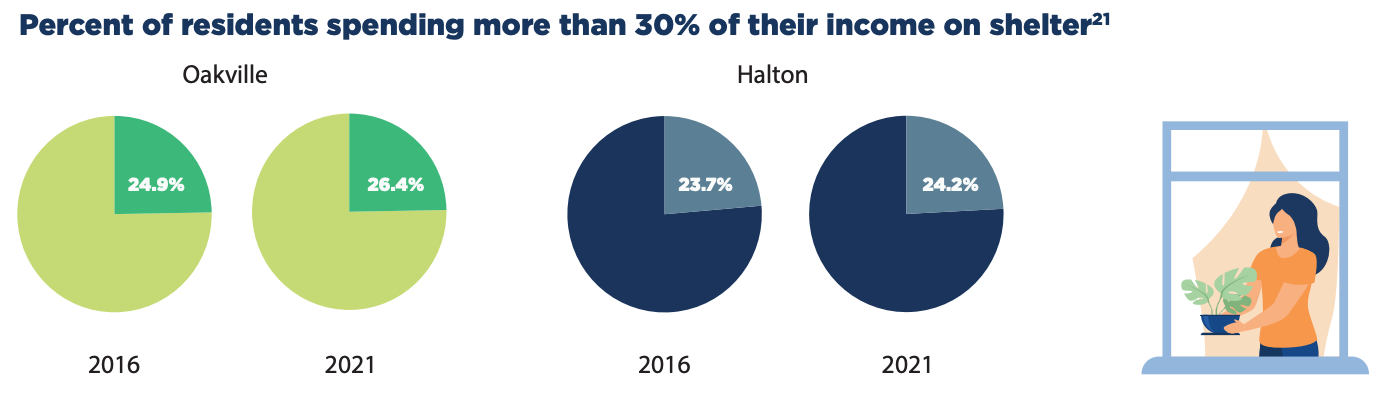
In Oakville, there has been a 22.3% increase in average monthly shelter costs for a homeowner and a 40.8% increase for a renter, between 2016 -2021. The average monthly cost is $2,384 and $2,146, respectively.
While the average after-tax income in Oakville is $108,000, we know that increasingly, Habitat for Humanity has been backstopping mortgage loans for higher-income Canadians making around $100,000 a year, citing the unaffordable housing market.
If higher-income Canadians are being supported by charities in order to afford to buy properties, what does that say for low-income Canadians? In Oakville, 8.6% of residents are considered to be low-income. Our community has notoriously been home to both the wealthiest and poorest in Halton, with average incomes varying wildly depending on the neighbourhood.
This are just a few excerpts from the report: Can You Afford to Live Here?
Click here to read: Can You Afford to Live Here?
The warming of Oakville is caused by the emissions of greenhouse gases from human activities. In 2022, emissions increased by 12.5% compared to 2021, surpassing pre-pandemic emission levels.

Here are some of the climate issues we are already experiencing as a community:
- Heat Warning: In the next few decades, we can expect around 33 to 36 days above 30ºC per year. Ward 7 has the highest average summer temperature at 31.8ºC. Extreme and prolonged heat days can trigger an increase in Emergency Department visits and hospitalization.
- More Ice and Wind Storms: Oakville is expecting an increase in extreme weather events, including a 45% increase in freezing rain events resulting in property damage and tree loss or tree stress.
The following are some of the mental and physical impacts that climate change can have on us as individuals:
- Cardiovascular Disease Leading to Death: For every 5ºC increase in temperature during the summer, there is a 2.5% increase in deaths, often caused by cardiovascular disease.
- Mental Health: Challenges such as post-traumatic stress disorder have been found among those who lived through extreme weather events.
A survey conducted by Sheridan College looked at the impact of climate emotions and anxiety on young people aged 16-25 in the Oakville community.
- 56% of respondents are very or extremely worried that climate change threatens people and the planet.
- Nearly 45% of respondents said their feelings about climate change negatively affect their daily life.
The following are a few projections that represent the world that our future generations—our children and our grandchildren, will live in:
- Increased Mortality Rate: Globally, climate change is expected to cause 250,000 additional deaths per year by 2050
- Decreased Water Supply: Climate change will reduce the quantity and quality of water in all Canadian regions on a seasonal basis due to increased water temperature, demand, and volatility